What is a TAM slide?
TAM is short for “total addressable market”, which is the total possible revenue that a business, product, or service could generate.
Most company pitch decks include a TAM slide. A TAM slide communicates the total addressable market available to your business, and the portion of the market that you expect to capture with your products and services.
Difference between TAM, SAM, and SOM
TAM isn’t the only metric that you’ll find in pitch decks. And it can be confusing to figure out what all the acronyms mean.
The three main market-focused metrics that you’ll find in pitch decks are:
- Total addressable market (TAM): The total possible revenue that a business, product, or service could generate if it captured 100% of the market.
- Serviceable addressable market (SAM): The portion of the TAM that your business’s products and services cover.
- Serviceable obtainable market (SOM): The share of SAM that you would reasonably expect to capture.
As you can see, TAM is the total market, SAM is a subset of TAM, and SOM is a subset of SAM.
The best way to master these three metrics is to look at an example:
TAM, SAM and SOM Example: Online Coffee Beans Company
- TAM: Total sales of packaged coffee beans reached approximately $438bn globally in 2022
- SAM: Total sales of packaged coffee beans sold through online channels was approximately $113bn in 2022
- SOM: Estimated sales through online direct-to-consumer and platform channels is approximately $14bn based on forecast marketing spend
How do you do TAM analysis?
There are two main ways to calculate the total addressable market for your TAM slide:
- Top-down, using industry research and market reports
- Bottom-up, by calculating from underlying drivers
Top-down
Top-down analysis is the easiest way to calculate TAM.
Put simply, you take an existing estimate of the total addressable market from an existing industry report and then try to predict the proportion of the market that the business will capture.
There are a few problems with this approach:
- It’s overly simplistic and there’s often not a good justification why your business could capture the portion of the market you’ve claimed.
- It’s not clear how the original industry reports calculated the total market size and whether it’s accurate.
- It completely misses the fact that the total addressable market could increase or decrease in size.
Bottom-up
A bottom-up analysis of TAM starts by calculating the number of units sold and their price, and then builds up a view of the overall market.
At a very simplistic level, you can estimate the total addressable market with:
TAM = Total number of customers in market x Average number of sales per customers x Average sale price
By calculating TAM using a bottom-up approach, you can also break down your market into different customer segments. These segments often have different needs and purchasing behaviors, and perhaps only some of your products address those segments. This is a more accurate view of the real world.
Example TAM slides
Airbnb
Key points:
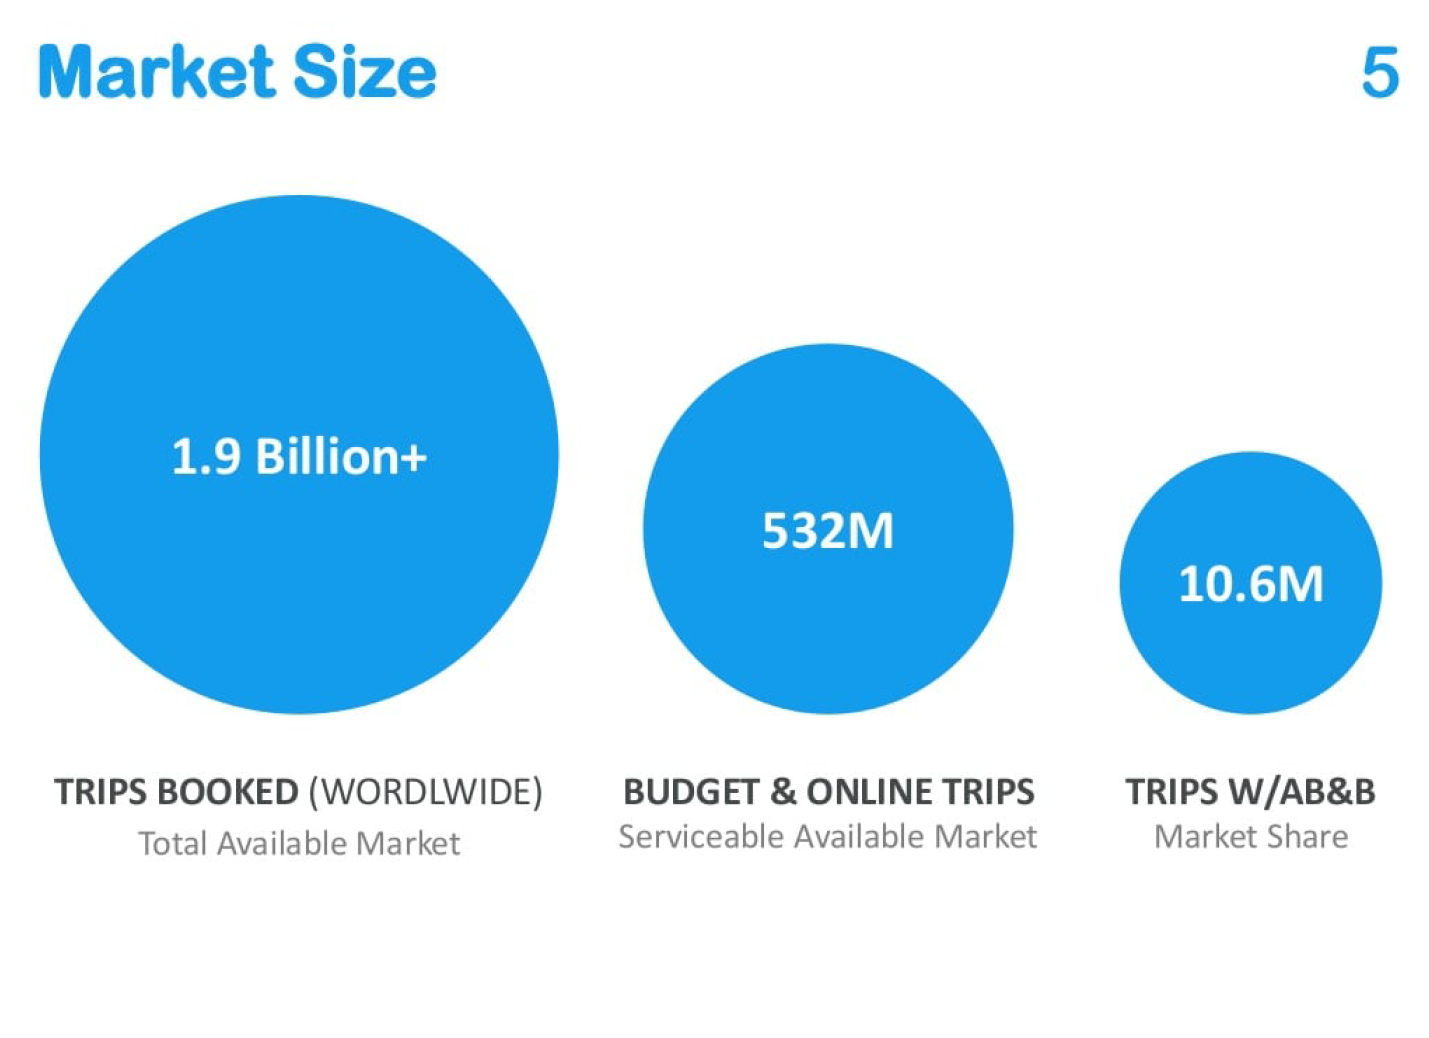
- Airbnb’s TAM slide uses a bubble format but the bubbles are not in proportion. If they were, then the opportunity would look even bigger for Airbnb.
- Airbnb also chose to use “number of trips” as their key TAM metric, but revenue would be a more appropriate and compelling metric for investors.
Intercom
Key points:
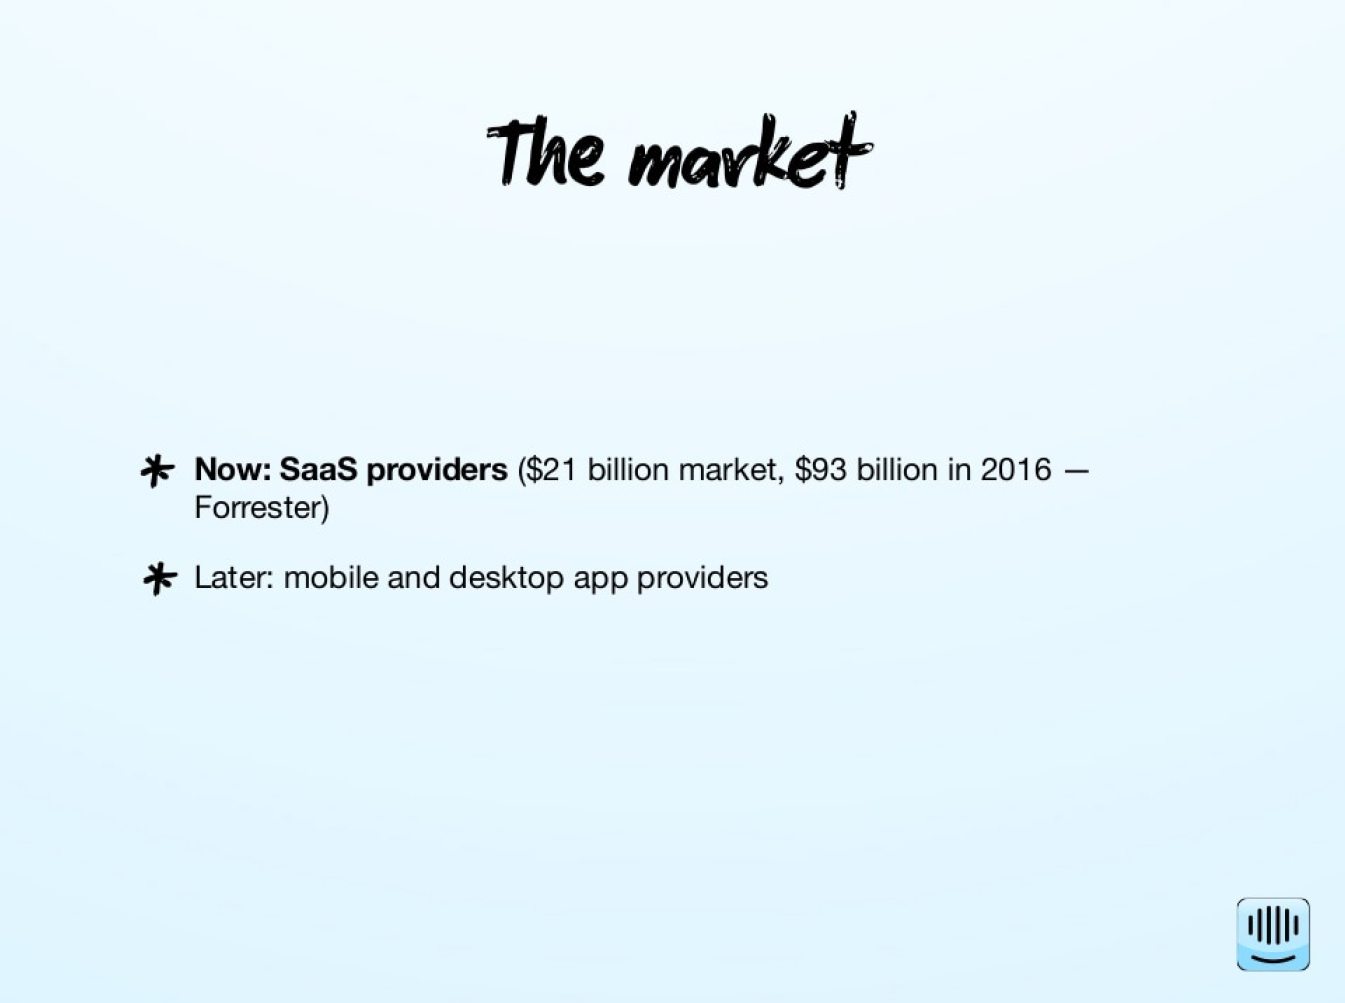
- Intercom’s TAM slide is very simple. There are no charts of graphics, just one line that communicates the TAM.
- It’s clear that Intercom used a top-down approach to TAM. They simply took Forrester’s estimate. Moreover, they didn’t try to address the question “how much of the total market do you expect to capture?”.
Revolut
Key points:
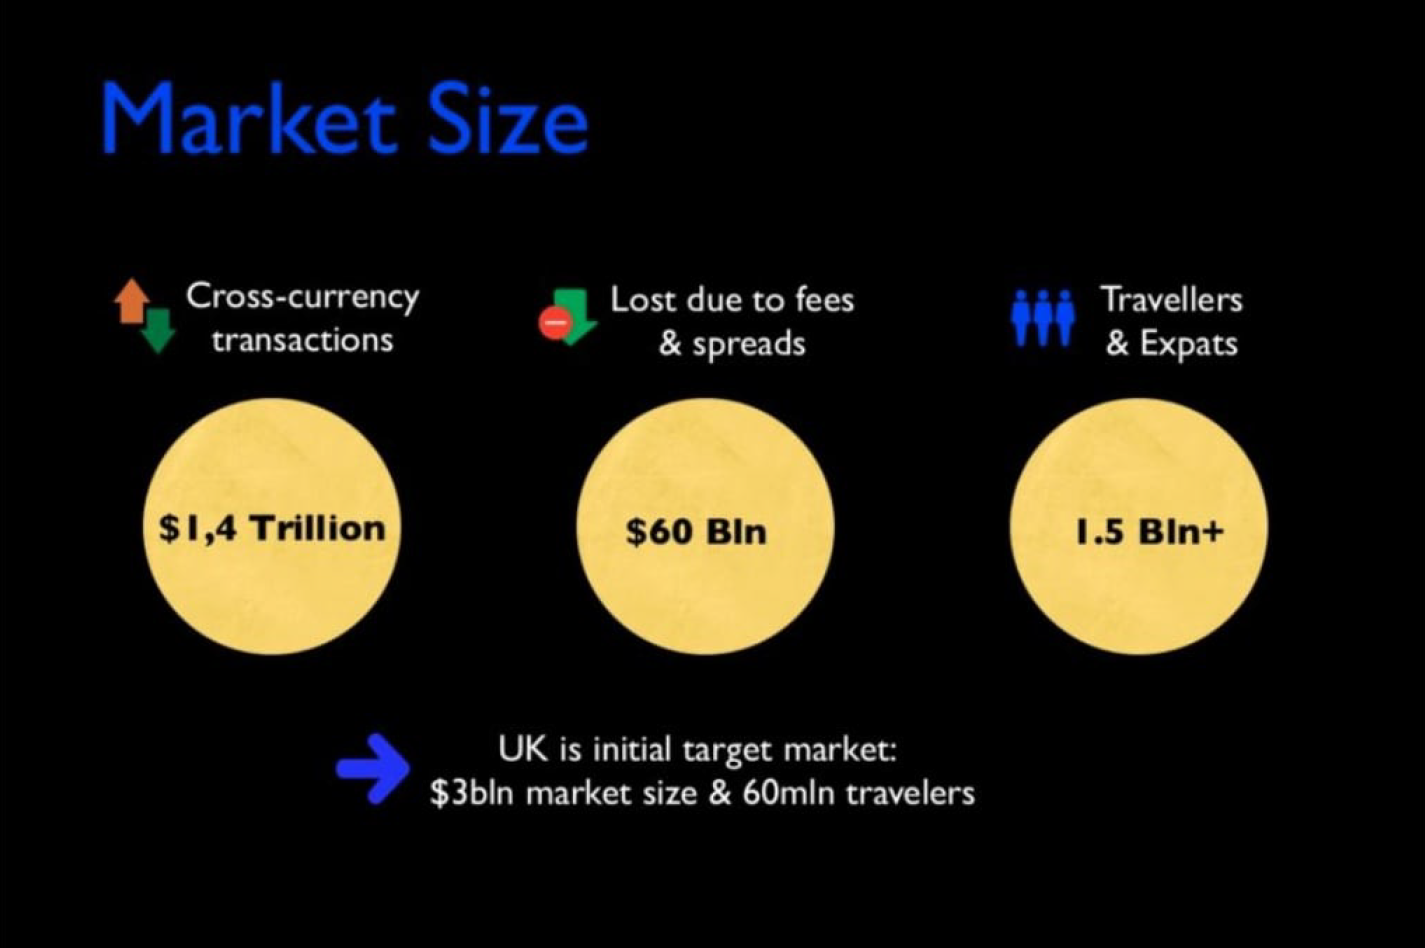
- Revolut’s TAM slide also uses a bubble format. Interestingly, they also don’t show relative differences between bubble sizes.
- They’ve chosen to describe their total addressable market in terms of both revenue and number of users.
SendGrid
Key points:
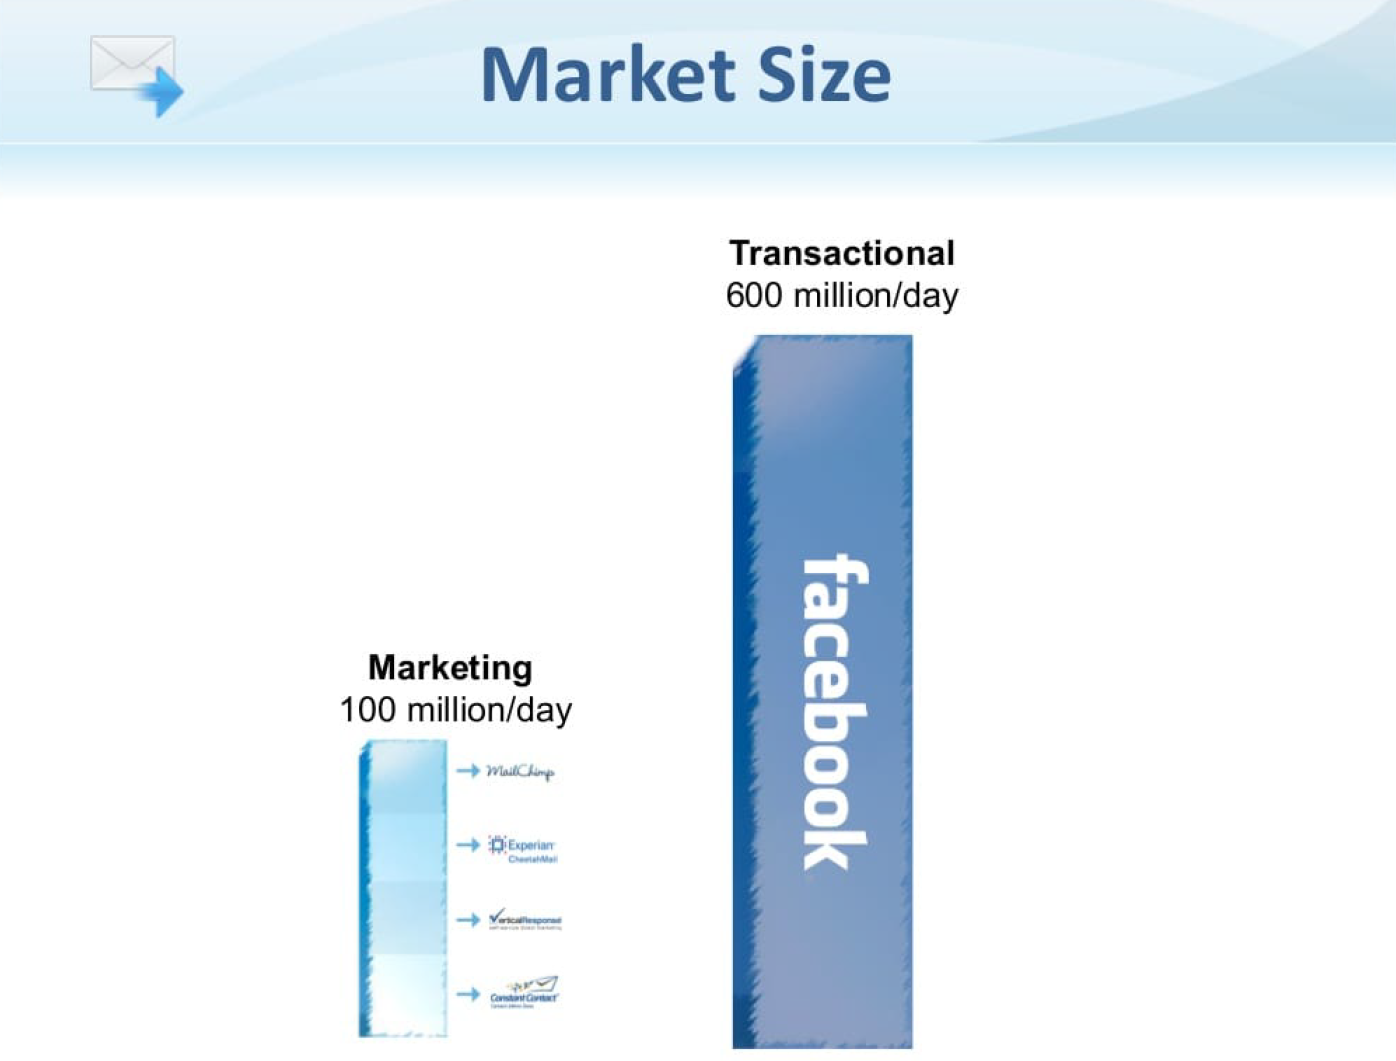
- SendGrid has chosen to describe their total addressable market in terms of the number of emails sent, not revenue.
- They realized that the narrow vertical of email marketing isn’t compelling enough, so they’ve considered the border market of social media transactional emails.
Shopify
Key points:
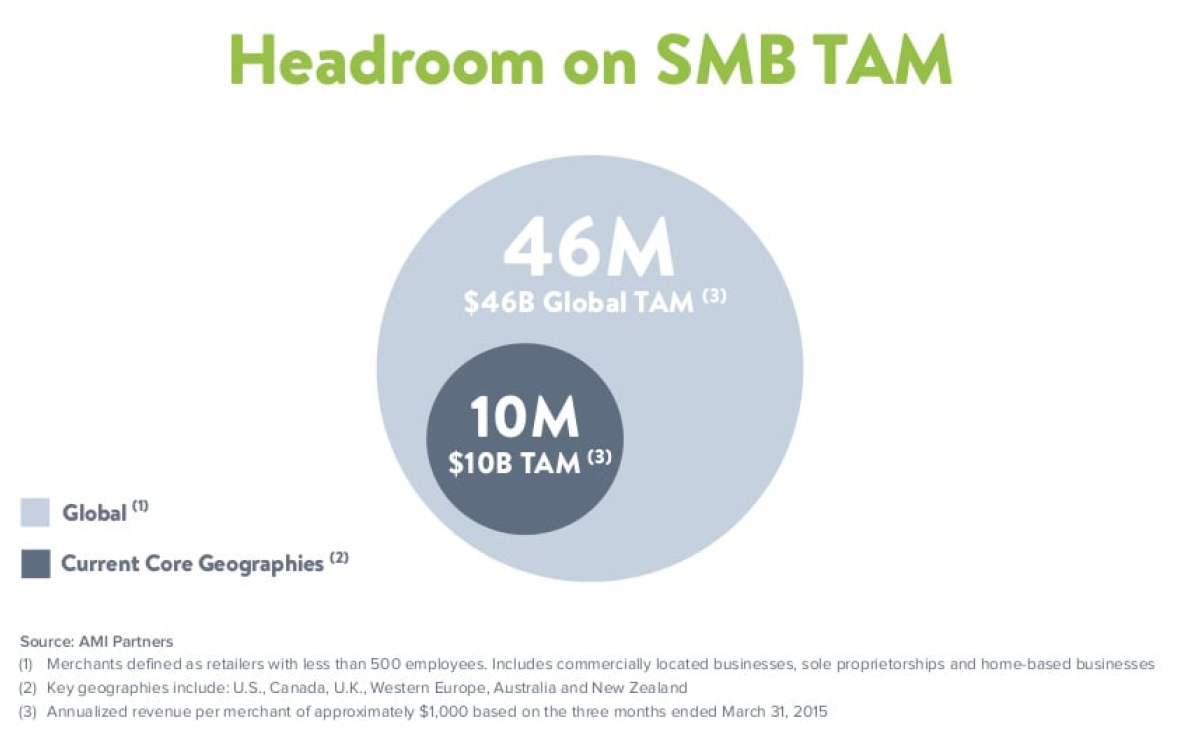
- Shopify’s TAM slide uses the common bubble format. They overlay the bubbles to show their TAM and SAM together.
- They’ve chosen to communicate TAM in terms of both revenue and number of users.
Square
Key points:
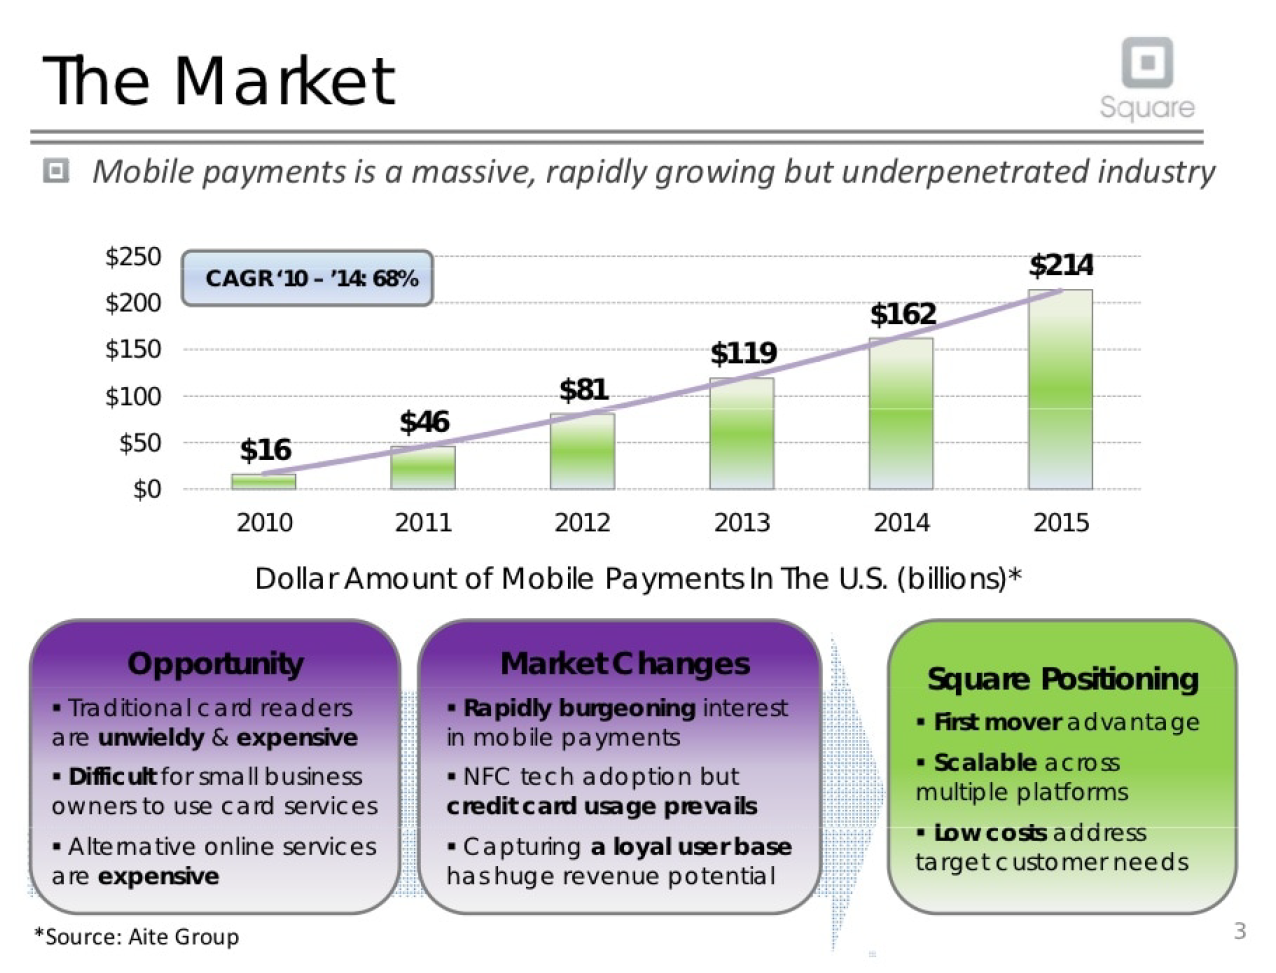
- Square’s TAM slide uses revenue as the key metric and also shows the market’s compelling growth over time.
- Underneath their TAM, they also communicate key opportunities and how Square is positioned to address them.
Uber
Key points:
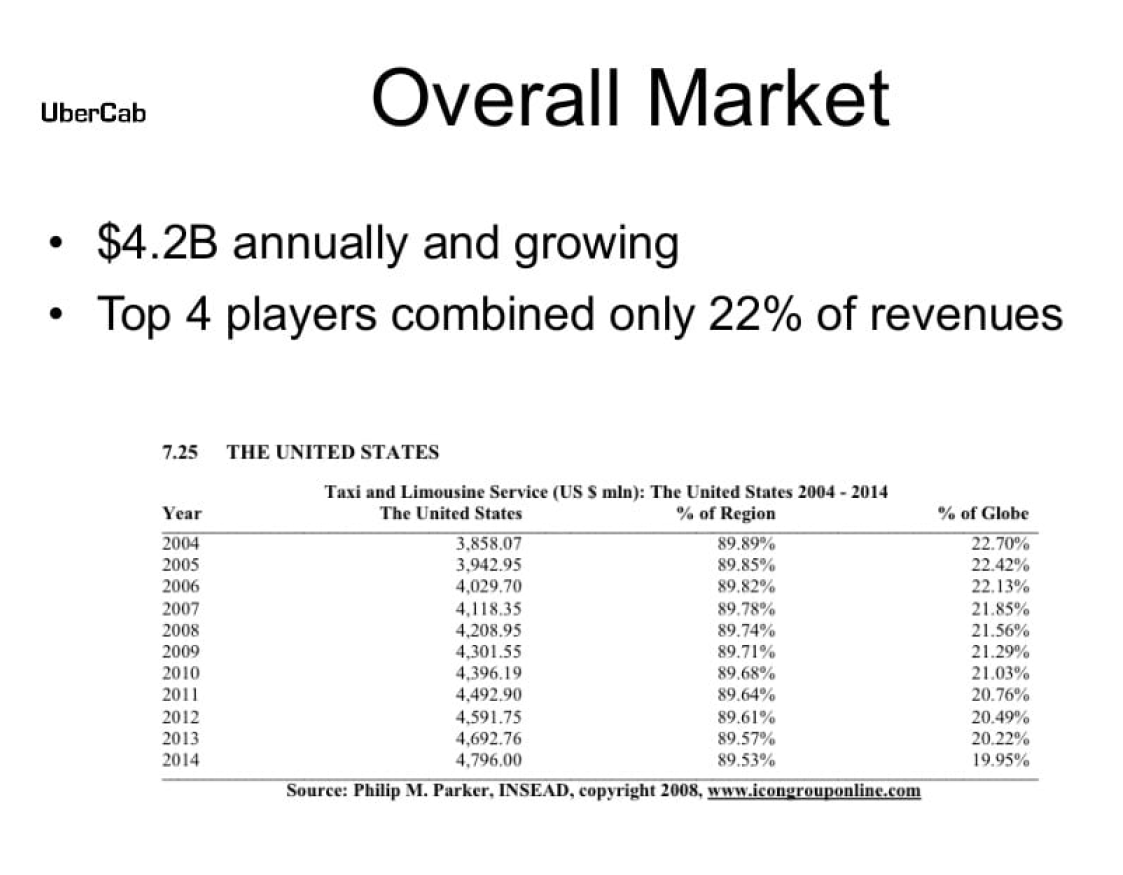
- Uber’s TAM slide uses a simple table to communicate the total addressable market.
- They’ve chosen a top-down approach by using data from INSEAD, which has significantly underestimated their TAM.
TAM slide templates
Looking for a TAM slide template for your pitch deck or consulting deck? We’ve put together a few templates that you can download for free:
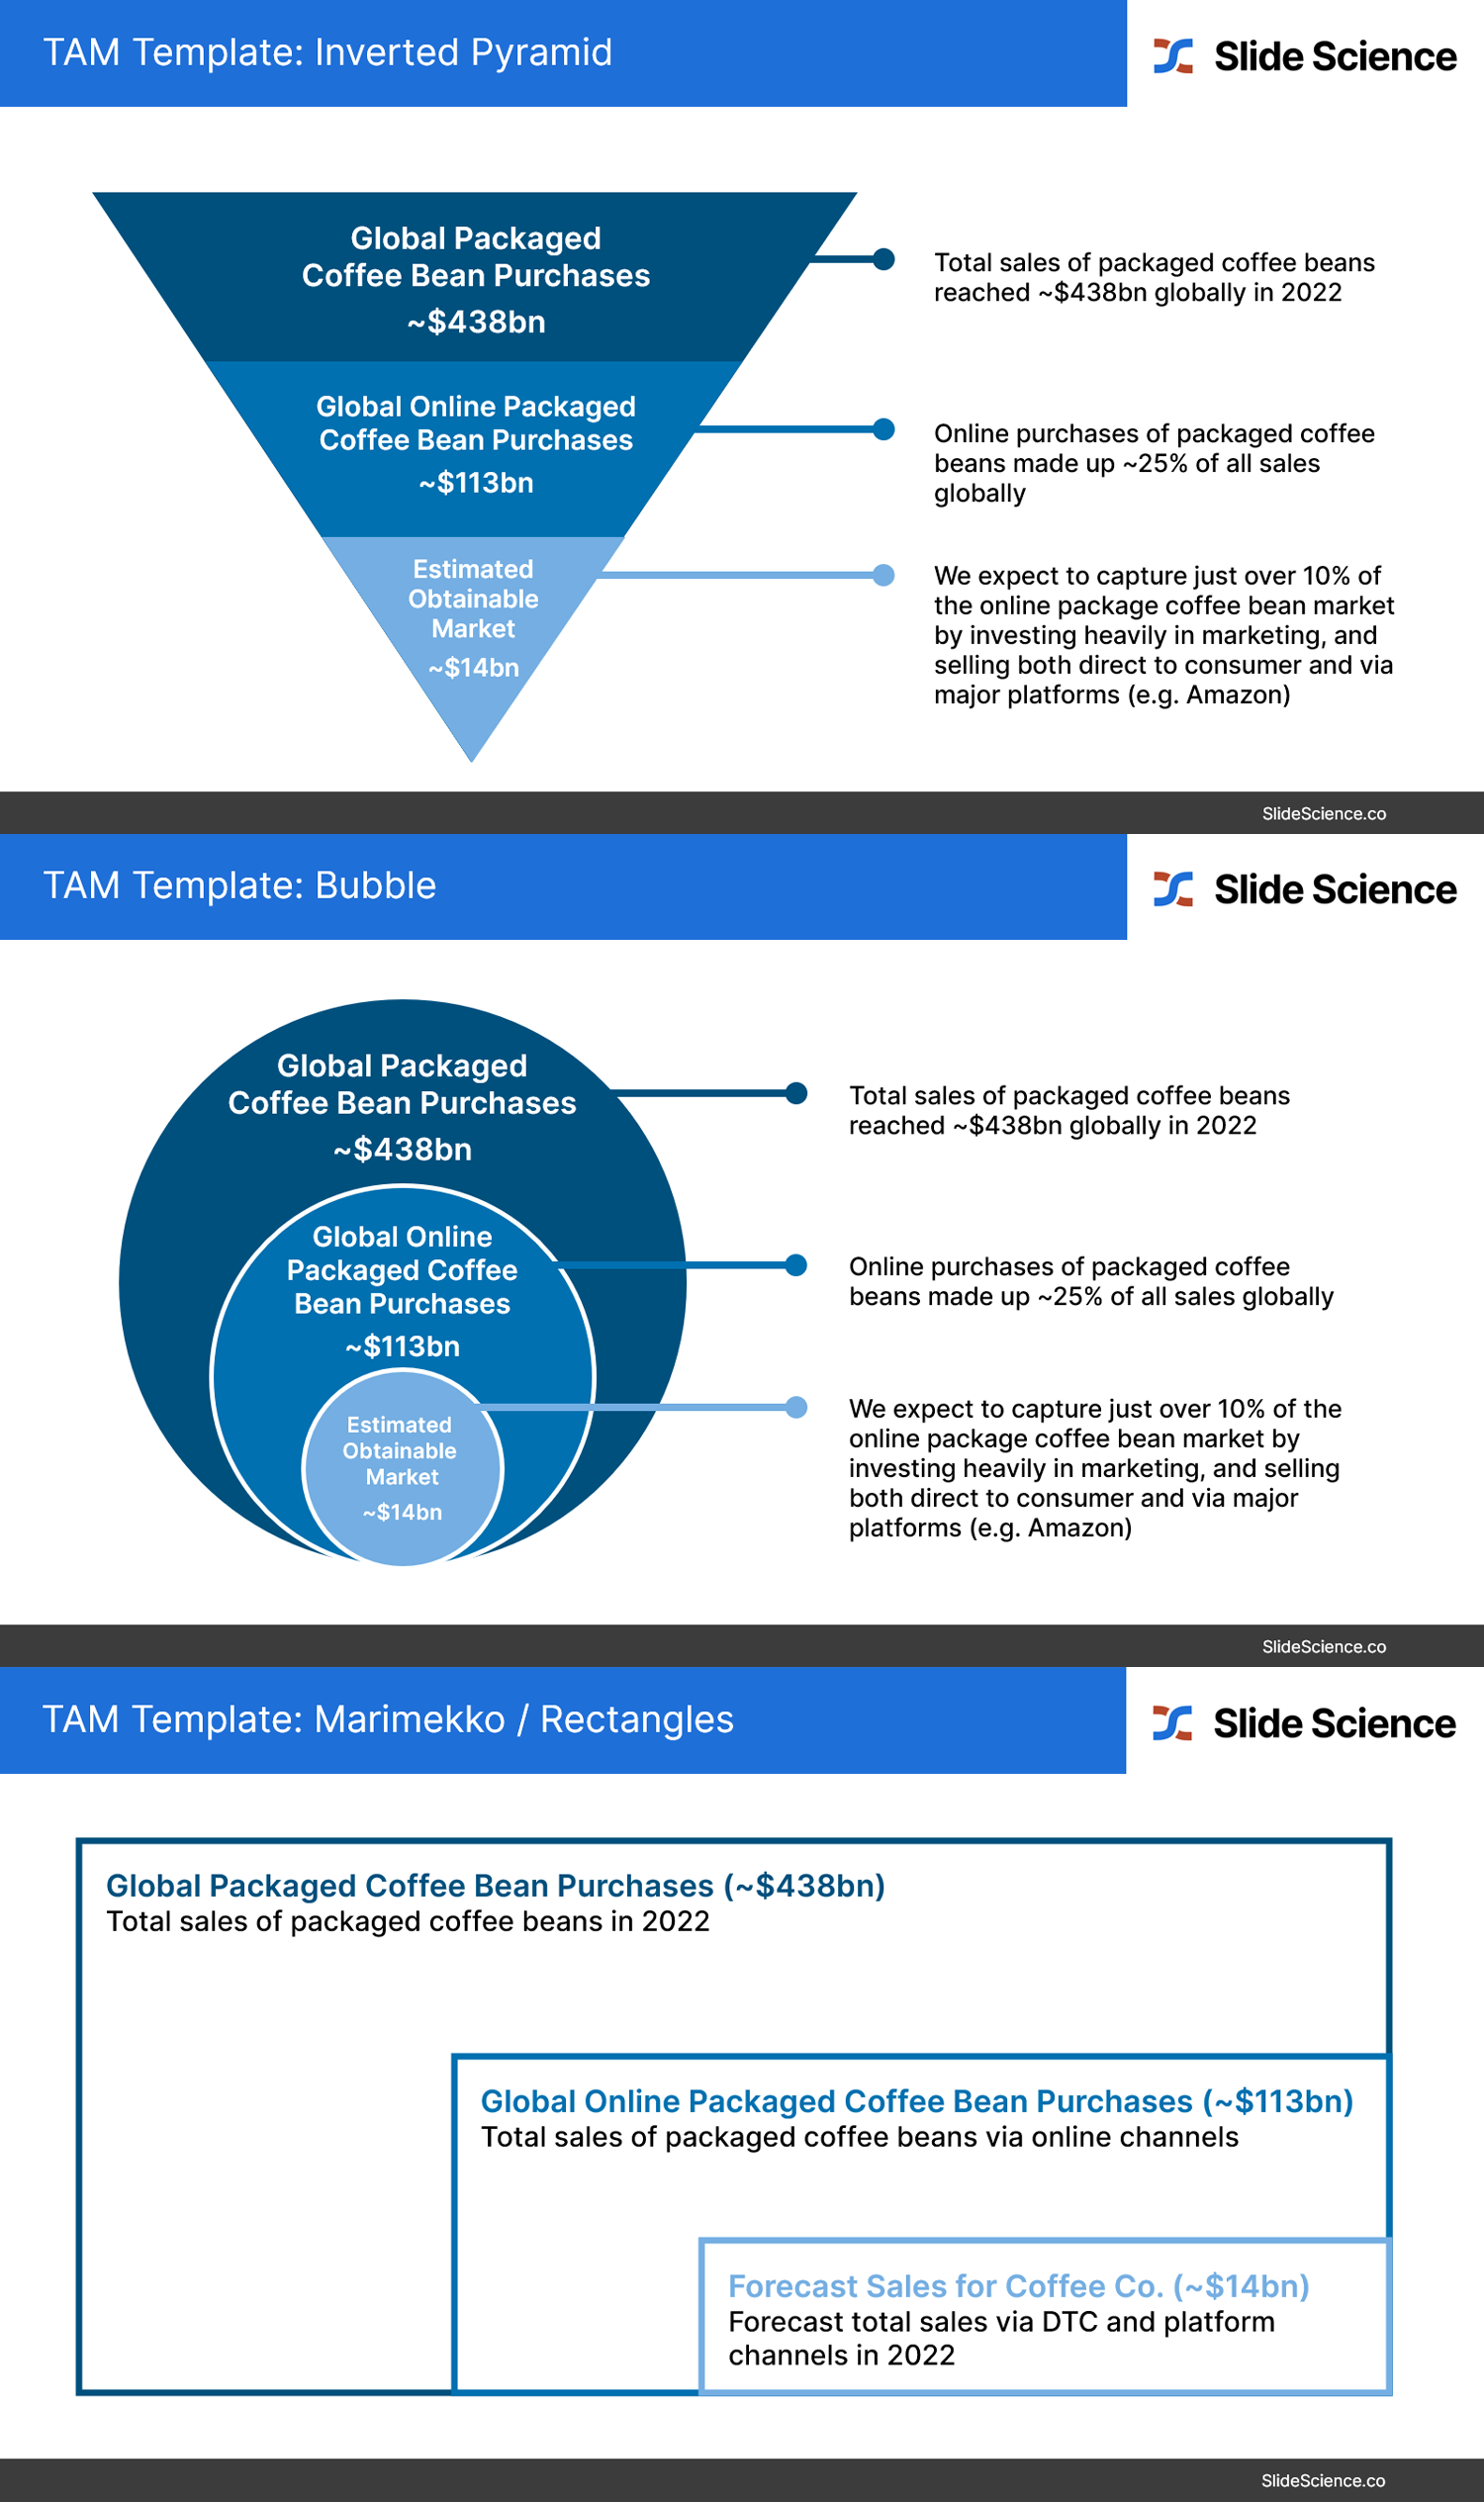
Download Slide Science’s TAM Slide Templates here (.pptx, 128kb)
