Why you should trust this review
I’ve spent a total of 5 years working as a consultant at a leading global firm and in the strategy team at one of the world’s largest banks. Over that time, I built literally thousands of slides using Think-Cell.
I also run the largest unofficial YouTube channel for Think-Cell tutorials and I’m featured in the Tips & Tricks section of the Think-Cell website.
Since leaving consulting, I teach consultants, corporate professionals and students how to communicate effectively using PowerPoint presentations.
Not only do I have a strong grasp of what is required to create professional, CEO-ready slide decks, but also have years of hands-on experience understanding the ins and outs of Think-Cell.
Why you should consider a PowerPoint charting add-on
When considering a PowerPoint charting add-on, you first need to determine why you’re looking for a solution. There are a few reasons why you might consider purchasing an add-on:
Firstly, you might want to increase the speed at which you create charts and slides in PowerPoint. Many charting add-ons simplify and improve the native PowerPoint user interface, workflows and integrations.
Secondly, you might want to create a chart that’s not available natively in PowerPoint. Some common charts that are missing from PowerPoint include waterfall charts, Mekko charts and Gantt charts.
And finally, you might want to increase the effectiveness of your charts with charting decorations and other features not available natively in PowerPoint. Some examples include CAGR arrows, value difference arrows, and value lines.
Our comprehensive Think-Cell review
Think-Cell is a PowerPoint add-on that helps you create advanced charts and slide layouts. It is the most popular PowerPoint charting add-on in the world. It’s used by over 950,000 people at over 23,000 companies, including 8 of the top 10 consulting firms.
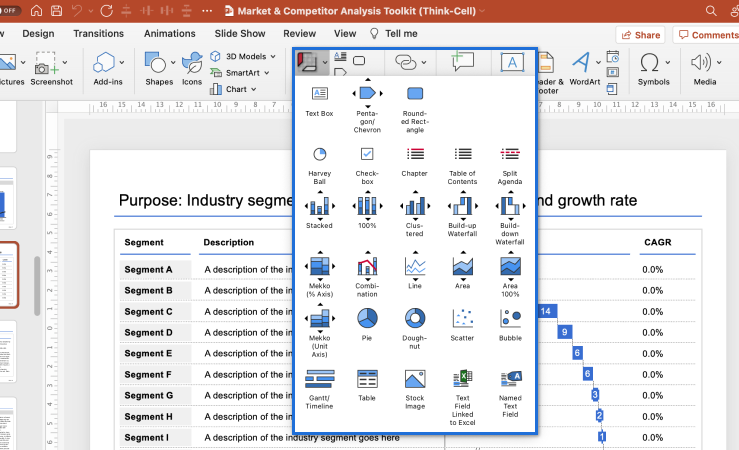
Think-Cell integrates seamlessly with PowerPoint. Once you install the Think-Cell plugin, a new section will appear under the “Insert” section of your PowerPoint ribbon.
The toolbar looks and behaves just like other native parts of the PowerPoint ribbon. And importantly, there is no lag as you click through the dropdowns and menus.

The toolbar gives you access to the key Think-Cell functionality. This includes:
- Charting: Column charts, bar charts, line charts, area charts, scatterplots, bubble charts, waterfall charts, Mekko charts, Gantt charts, and more.
- Layouts: Text boxes, process flows and tables that automatically re-arrange to fit their contents. Plus agendas and tables of contents.
- Excel integrations: Automatically populating and updating a chart’s data from an external Excel file.
- Extended PowerPoint functionality: Useful functionality that’s not found natively in PowerPoint, such as saving and sending individual slides.
We’ll cover each of these in more detail in the next few sections.
Charting options
Think-Cell contains a wide range of different chart types, including column charts, bar charts, line charts, area charts, scatterplots, bubble charts, waterfall charts, Mekko charts, Gantt charts, and more.
It’s very simple to insert a chart. You simply click on the elements menu, click on the chart that you’d like to use, and then drop the chart anywhere on your slide canvas.

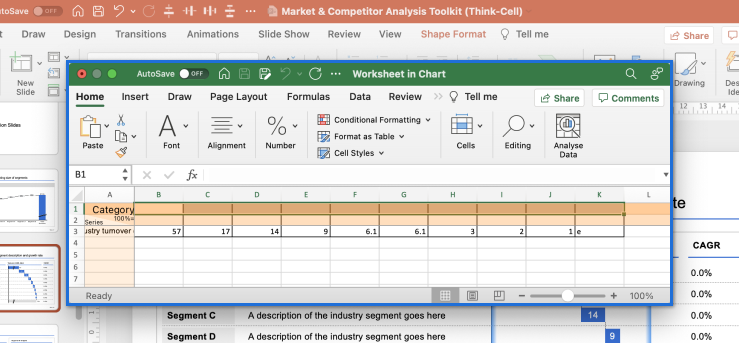
Once you have inserted your chart on your slide canvas, a popup containing an Excel datasheet will appear. This is where you insert the data for your chart. Not only can you type in raw numbers, but you can use Excel formulas for dynamic calculations.

It’s also very simple to edit your charts. For example, you can resize the chart by dragging the edges of the chart to the desired size. And you can rotate the chart by selecting the rotation handle at the top of the chart and dragging it to the desired angle.
Think-Cell also gives you a lot of control over the style of your chart. When you left-click on any element within the chart, a floating toolbar will appear with the styling and customization options available for that element.
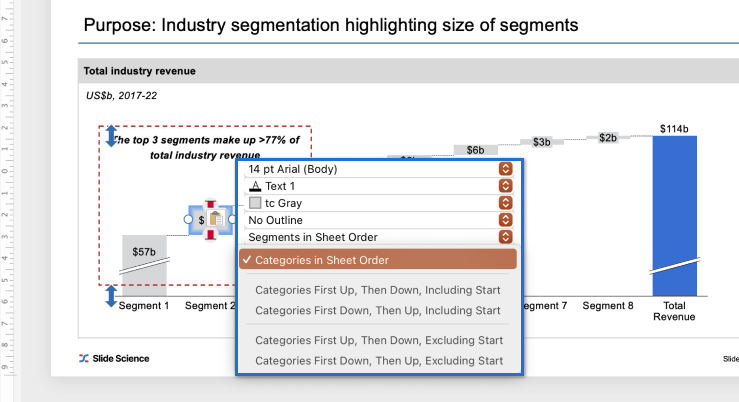
Compared to other PowerPoint charting add-ons, Think-Cell excels by giving you precise control over how data is presented in the chart. For example, you can easily change the order of chart categories or segments without editing the underlying data.
Chart decorations
One of the things that make presentations by consulting firms so powerful is their use of chart decorations. And Think-Cell has the largest range of chart decorations of any PowerPoint charting plugin.
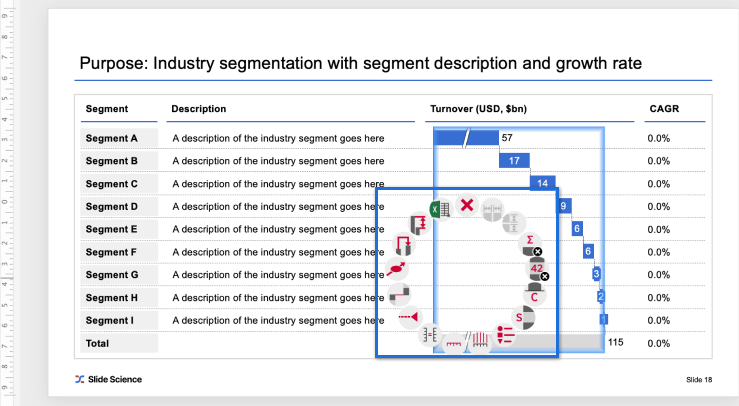
Accessing chart decorations is very easy, simply right-click anywhere on the chart and a circular list of icons will appear. These are all the chart decorations available for your chart type.

As a Think-Cell user who builds corporate and consulting-style slide decks, you’ll most commonly be using CAGRs, difference arrows, value lines, axis breaks, and cross-chart connectors.

One of the great things about Think-Cell is that they automatically calculate key metrics for you. For example, if you add a CAGR arrow to your chart, it will calculate the CAGR automatically based on the values and number of periods in the chart. If you adjust the range of the CAGR arrow, the calculation updates automatically.
Layouts and other elements
As a consultant, you’re often required to update existing slides as new data comes along or when your manager has a change of heart about how the slide should look.
This is a tedious process using PowerPoint. You need to manually adjust the size of the shapes or other elements that you’re using on the slide, re-align them, and then often change the font size to fit into the new layout.
Using Think-Cell, you can create complex layouts which will automatically re-arrange and re-align as you add or remove elements. For example, you can add an additional column to a slide layout and all the other columns resize automatically.

That being said, Think-Cell’s implementation of auto-layouts is not particularly intuitive. It takes quite a bit of time to become really competent in building slides using this feature. Plus, there are some limitations on what types of spacing you can have in your layout.
But if you’re comfortable giving up a little control over the “pixel perfectness” of your layouts and are willing to put in the effort to learn, then Think-Cell’s layout feature is a great way to build slide layouts that are simple to update.
Excel integration and automation
There’s nothing worse than repeatedly copying and pasting data from Excel to PowerPoint as you update multiple charts. Fortunately, Think-Cell is integrated with Excel.
This means that you can connect your Think-Cell charts in PowerPoint to data that lives in Excel. As the Excel data changes, the Think-Cell charts are automatically updated.
Unlike other solutions, it is very difficult to accidentally “break” this data link. If you rename the files, the data link remains. If you copy the paste the charts somewhere else, the data link remains. If you email the files to somebody else, when they open the files the data link remains.
Compatibility
Even though you might use Think-Cell, you cannot assume that your partners or clients will. So it’s important that any charts or other elements that are built in Think-Cell do not break for people without the plugin.
For users without Think-Cell, all Think-Cell charts and other elements will natively fallback to PowerPoint native charts and shapes. The best part? They maintain the styling and chart decorations that were created in Think-Cell (e.g. CAGR arrows).